【Seaborn】set_style関数による見た目の変更
公開日 2023-09-03
Seabornのset_style関数を用いてグラフの背景色や罫線などの見た目を変更する方法を解説します。set_style関数の最初の引数、またはstyle引数にスタイルを文字列で渡します。指定できるスタイルは以下の通りです。
ticks: 白色の背景、罫線なし、目盛り線あり(デフォルト)darkgrid: 灰色の背景、罫線ありwhitegrid: 白色の背景、罫線ありdark: 灰色の背景、罫線なしwhite: 白色の背景、罫線なし
set_style関数で設定したスタイルは、それ以降のグラフにも継続して設定されます。スタイルを元に戻す場合、以下を実行してデフォルトのticksスタイルにします。
sns.set_style("ticks")なお、sns.reset_defaults()関数を使用してスタイルを元に戻そうとした場合、rcParamsというMatplotlibの設定が全てデフォルトに戻され、Seabornの設定が消去されます。そのため、グラフのサイズなどがSeabornのデフォルト設定から変化してしまいますので推奨しません。
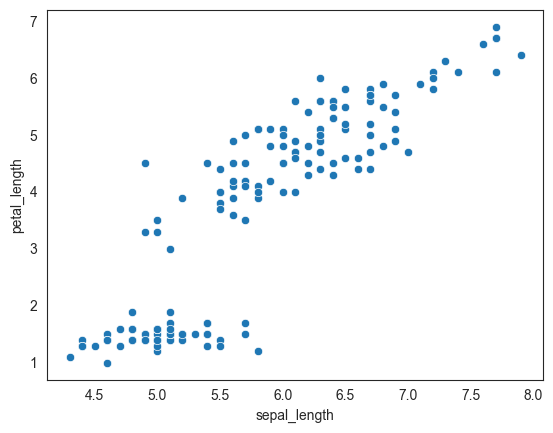
ticks
デフォルトのスタイルであるticksを示します。軸に目盛り線が表示されます。表示するデータには、Seabornのirisデータセットを使用しています。
import seaborn as sns

df = sns.load_dataset("iris")
sns.scatterplot(data=df, x="sepal_length", y="petal_length")
<Axes: xlabel='sepal_length', ylabel='petal_length'>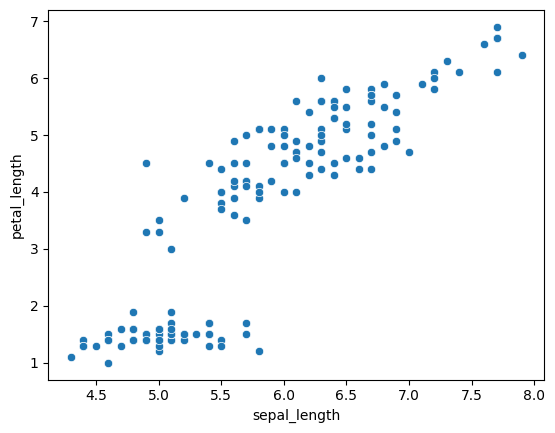
darkgrid
darkgridスタイルの例を以下に示します。灰色の背景、かつ罫線ありとなります。
sns.set_style("darkgrid")
sns.scatterplot(data=df, x="sepal_length", y="petal_length")
<Axes: xlabel='sepal_length', ylabel='petal_length'>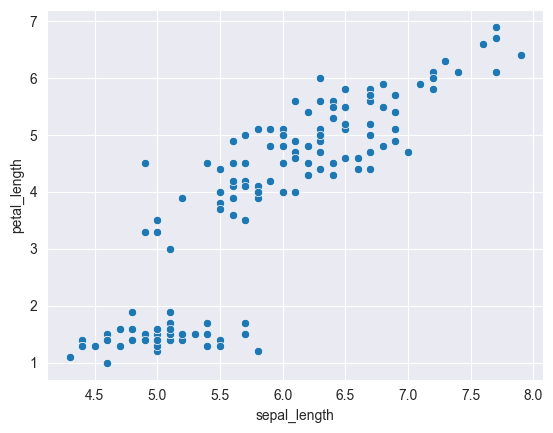
whitegrid
whitegridスタイルの例を以下に示します。白色の背景、かつ罫線ありとなります。
sns.set_style("whitegrid")
sns.scatterplot(data=df, x="sepal_length", y="petal_length")
<Axes: xlabel='sepal_length', ylabel='petal_length'>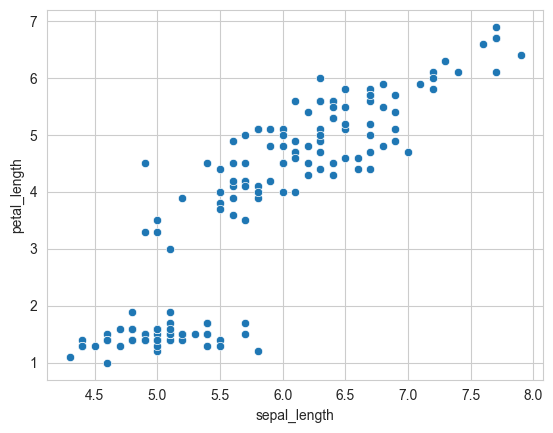
dark
darkスタイルの例を以下に示します。灰色の背景、かつ罫線なしとなります。
sns.set_style("dark")
sns.scatterplot(data=df, x="sepal_length", y="petal_length")
<Axes: xlabel='sepal_length', ylabel='petal_length'>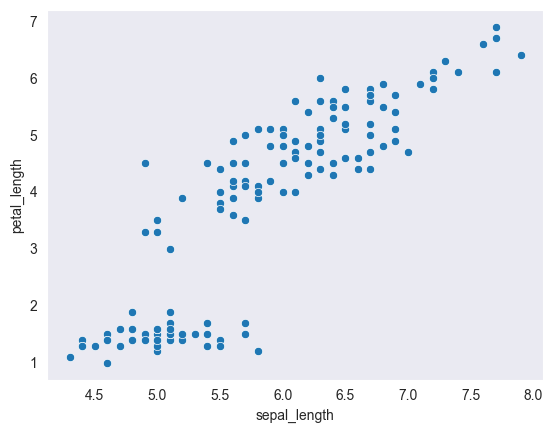
white
whiteスタイルの例を以下に示します。白色の背景、かつ罫線なしとなります。
sns.set_style("white")
sns.scatterplot(data=df, x="sepal_length", y="petal_length")
<Axes: xlabel='sepal_length', ylabel='petal_length'>