Matplotlibの箱ひげ図
公開日 2023-08-10
最終更新日 2024-08-18
箱ひげ図をプロットするには、ax.boxplotを使用します。ax.boxplotに渡すデータ(以下の例ではx)が1次元配列の場合、箱ひげ図は1個だけ出力されます。一方、データが2次元配列の場合、箱ひげ図は列の数だけ出力されます。
import numpy as np
import matplotlib.pyplot as plt
import matplotlib_fontja

np.random.seed(seed=0)
x = np.random.normal(10, 5, 1000).reshape(-1,2)
# 平均10, 標準偏差5の正規分布。500行2列の配列データを生成

fig, ax = plt.subplots()
ax.boxplot(x)
plt.show()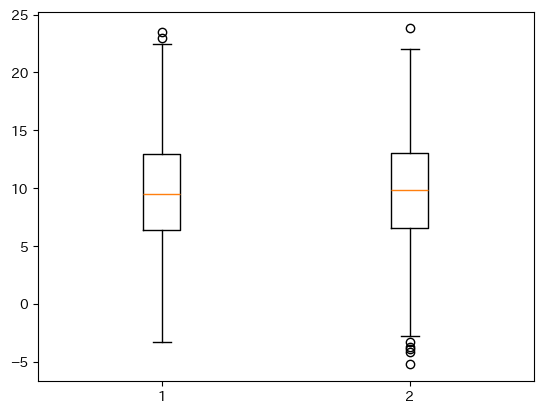
箱ひげ図の説明を以下に示します。IQRは第1四分位点から第3四分位点までの長さです。デフォルトのひげの長さは1.5×IQRとなります(長さはwhisオプションで変更可能です)。
fig, ax = plt.subplots()
ax.boxplot(x[:, 0])
ax.annotate("外れ値", xy=(1.03, 23.5), xytext=(1.2, 22.5), size=15, arrowprops={"arrowstyle": "->"})
ax.annotate("Q3+1.5×IQR", xy=(1.04, 22.5), xytext=(1.15, 20), size=15, arrowprops={"arrowstyle": "->"})
ax.annotate("第3四分位点(Q3)", xy=(1.08, 13), xytext=(1.15, 12.5), size=15, arrowprops={"arrowstyle": "->"})
ax.annotate("中央値", xy=(1.08, 9.5), xytext=(1.15, 9), size=15, arrowprops={"arrowstyle": "->"})
ax.annotate("第1四分位点(Q1)", xy=(1.08, 6.5), xytext=(1.15, 6), size=15, arrowprops={"arrowstyle": "->"})
ax.annotate("Q1-1.5×IQR", xy=(1.04, -3), xytext=(1.15, -2), size=15, arrowprops={"arrowstyle": "->"})
ax.annotate("", xy=(0.9, 13.5), xytext=(0.9, 6), arrowprops={"arrowstyle": "<->"})
ax.text(0.82, 9.5, "IQR", size=15)
plt.show()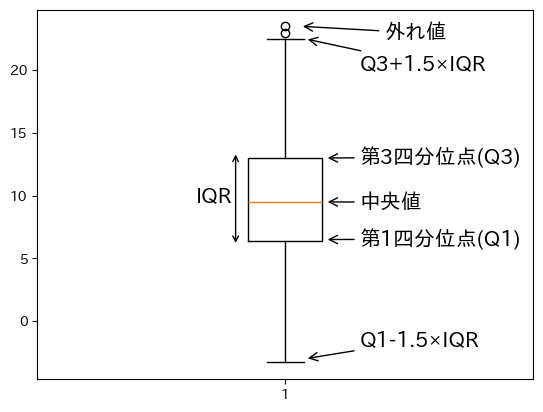
boxplotのオプション
boxplotで指定できる主なオプションを以下に示します。
sym(str): 外れ値記号の見た目flierprops(dict): 外れ値記号の見た目vert(bool):Trueの場合、箱ひげ図は横向きになる(デフォルト:False)whis(float/(float, float)): ひげの開始位置(デフォルト:1.5)widths(float): 箱の幅labels(sequence): データのラベル(横軸に表示)showmeans(bool):Trueの場合、平均値を表示する(デフォルト:False)
外れ値記号の見た目
symオプションやflierpropsオプションで外れ値の色と記号を変更できます。
symオプション(str形式)では、色と記号を組み合わせて指定できますが、その場合は1文字で定義できる色しか対応していないようです。
詳細に設定する場合は、flierpropsオプション(dict形式)を用います。主な指定可能オプションを以下に示します。
| キー | 説明 |
|---|---|
marker | マーカーの形状 |
markerfacecolor | 塗り潰しの色 |
markeredgecolor | マーカーの枠線の色 |
ms | マーカーのサイズ |
1文字で定義できる色と、マーカーの種類を以下に示します。
| color | 説明 |
|---|---|
b | 青 (Blue) |
g | 緑 (Green) |
r | 赤 (Red) |
c | シアン (Cyan) |
m | マゼンタ (Magenta) |
y | 黄 (Yellow) |
k | 黒 (Black) |
w | 白 (White) |
| marker | 説明 |
|---|---|
o | 丸 |
v | 下向き三角 |
^ | 上向き三角 |
< | 左向き三角 |
> | 右向き三角 |
s | 四角形(square) |
p | 五角形(pentagon) |
+ | +記号 |
x | x記号 |
D | ダイヤモンド |
fig, ax = plt.subplots()
ax.boxplot(x, sym="b+") # 青の+記号
plt.show()
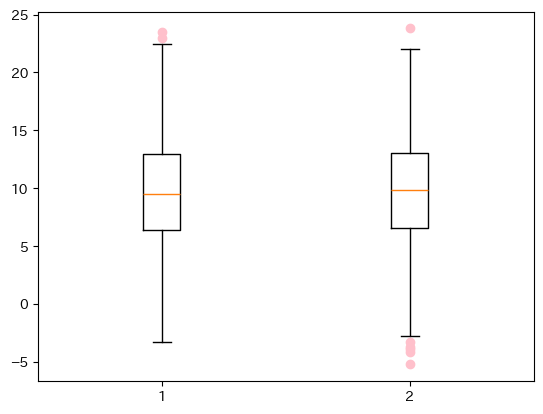
fig, ax = plt.subplots()
ax.boxplot(x, sym="pink") # 記号の種類を定義しない場合、複数文字の色も指定できる
plt.show()
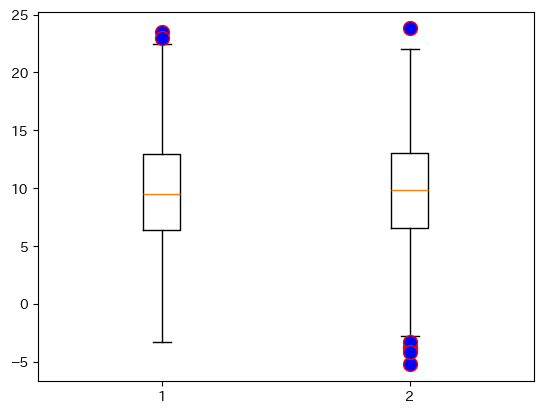
fig, ax = plt.subplots()
ax.boxplot(x, flierprops={"marker":"o", "markerfacecolor":"blue", "markeredgecolor":"red", "ms":10})
plt.show()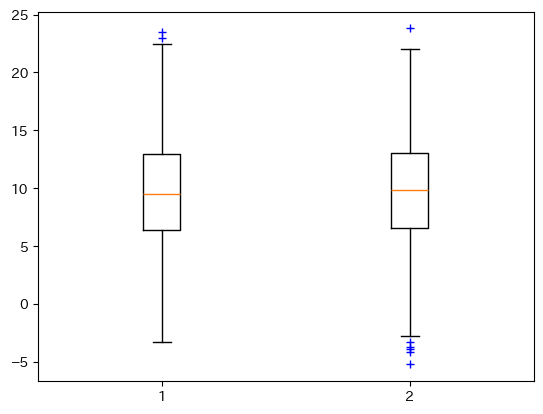
横向きの箱
箱を横向きにするには、vert=Falseと指定します。
fig, ax = plt.subplots()
ax.boxplot(x, vert=False)
plt.show()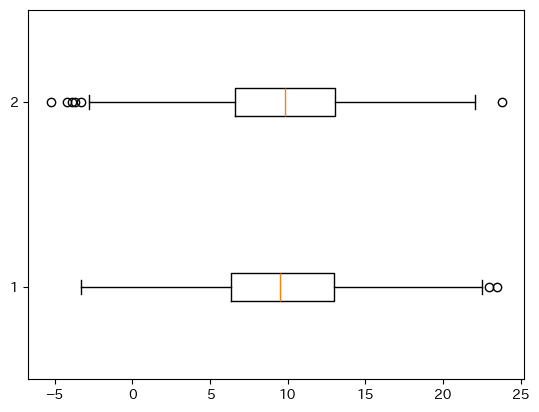
ひげの長さ
ひげの開始位置はwhisオプションで変更できます。指定する方法は2つあり、float型の変数を1つ与える場合と、(float, float)とタプルで与える場合で挙動が異なります。
まず、float型の変数を1つ与える場合、ひげの長さはIQR×whisとなります(whisのデフォルト値は1.5. また、IQRは第1四分位点と第3四分位点の長さです)。
以下はwhis=1とした例です。ひげの長さと箱の長さは同じとなります。
fig, ax = plt.subplots()
ax.boxplot(x, whis=1)
plt.show()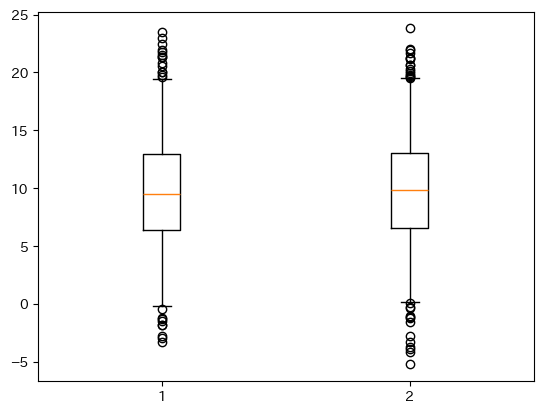
次に、whisオプションに(float, float)とタプルで与える場合について述べます。例えばwhis=(1, 99)として与えた場合、データの下位から1%~99%の範囲を含むように長さが設定されます。
fig, ax = plt.subplots()
ax.boxplot(x, whis=(1, 99))
plt.show()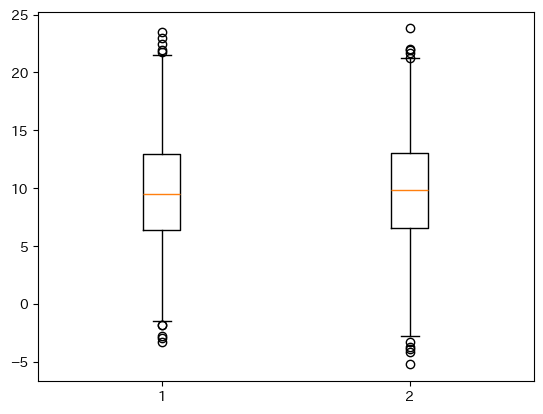
箱の幅
widthsオプションで箱の幅を指定できます(デフォルトは0.5、またはグラフの幅から自動的に決定されます)。
fig, ax = plt.subplots()
ax.boxplot(x, widths=0.3)
plt.show()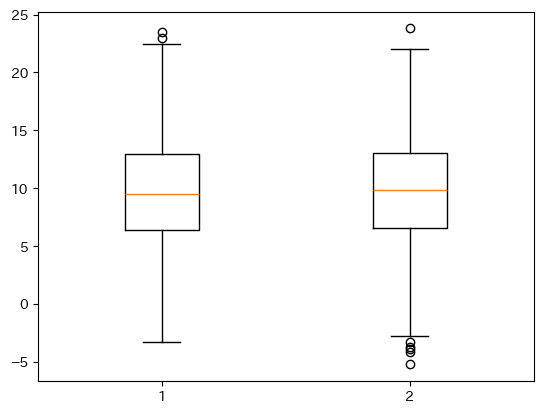
データのラベル
tick_labelsオプションでデータのラベルを指定できます(Matplotlib 3.8以前ではlabelという名前でしたが、3.9以降はtick_labelsが推奨されています。3.11以降ではlabelは使えなくなります)。
fig, ax = plt.subplots()
ax.boxplot(x, tick_labels=["AAA", "BBB"])
plt.show()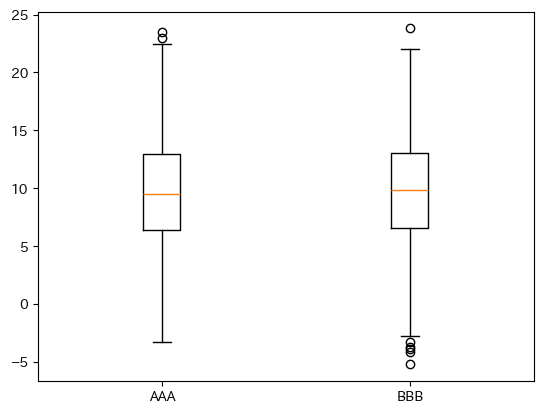
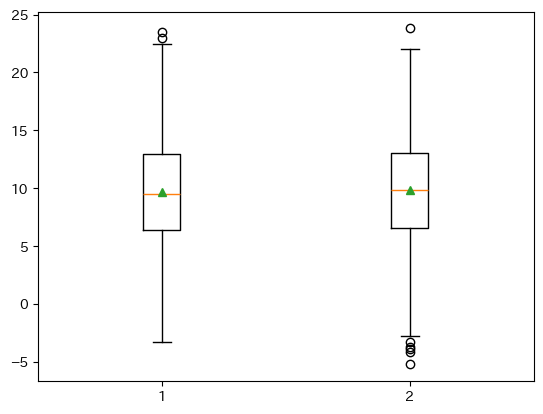
平均値の表示
平均値を表示するにはshowmeans=Trueとします。平均値マーカーの表示方法は、meanpropsオプションに辞書形式で指定できます。
fig, ax = plt.subplots()
ax.boxplot(x, showmeans=True)
plt.show()
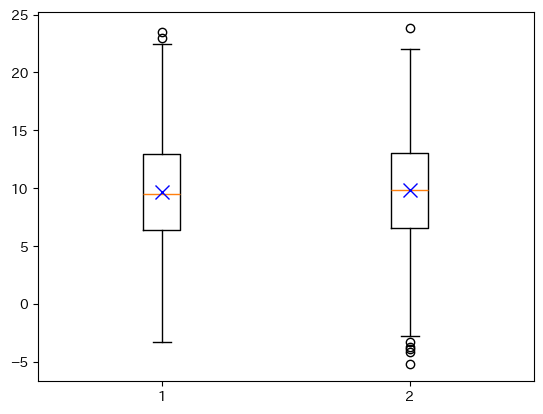
fig, ax = plt.subplots()
ax.boxplot(x, showmeans=True, meanprops={"marker":"x", "markeredgecolor":"blue", "ms":10})
plt.show()