Matplotlibの軸の設定
公開日 2023-08-10
このページではMatplotlibの軸の設定について解説します。
軸のラベル
軸にラベルを表示するには、x軸ではax.set_xlabel()メソッド、y軸ではax.set_ylabele()メソッドを使用します。以下に例を示します。
import matplotlib.pyplot as plt

fig, ax = plt.subplots()
ax.scatter([1, 2, 3], [4, 5, 6])
ax.set_xlabel("X axis")
ax.set_ylabel("Y axis")
plt.show()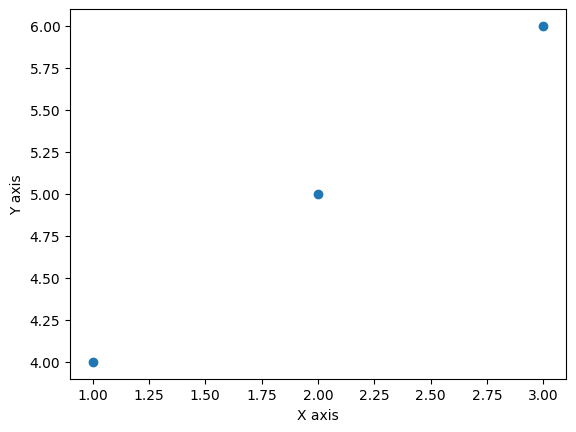
また、ax.set_xlabel(), ax.set_xlabel()メソッドの主なオプションを以下に示します。
| オプション | 型 | 説明 |
|---|---|---|
| labelpad | float | ラベルと軸の距離(デフォルト:4) |
| loc | str | ラベルの位置。‘center’(デフォルト)、‘left’, 'right’から選択 |
| color | str | 文字の色 |
| size | float/str | 文字の大きさ |
fig, ax = plt.subplots()
ax.scatter([1, 2, 3], [4, 5, 6])
ax.set_xlabel("X axis", labelpad=20, loc="left")
ax.set_ylabel("Y axis", color="red", size=15)
plt.show()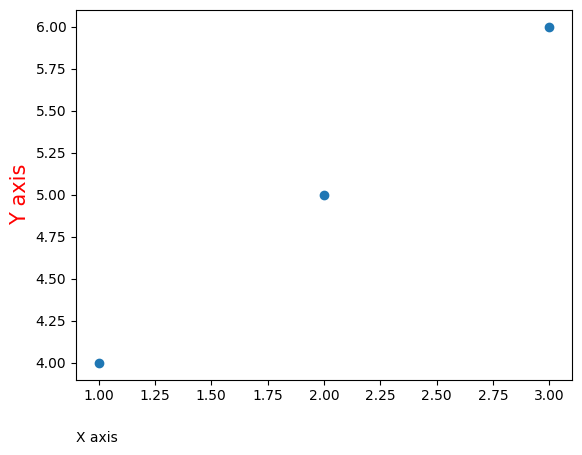
軸の範囲
軸の範囲を指定するには、x軸ではax.set_xlim()メソッド、y軸ではax.set_ylim()メソッドを使用します。最初の引数に軸の下限値を、2番目の引数に上限値を与えます。
fig, ax = plt.subplots()
ax.scatter([1, 2, 3], [4, 5, 6])
ax.set_xlim(-10, 10)
ax.set_ylim(-10, 10)
plt.show()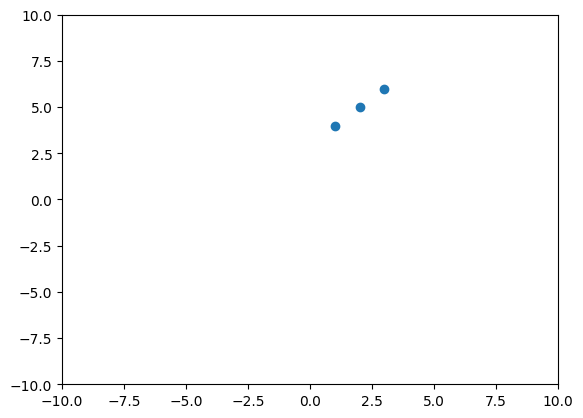
軸の下限値か上限値の片方のみ指定したい場合、自動的に決めて欲しい側にNoneを与えます。
fig, ax = plt.subplots()
ax.scatter([1, 2, 3], [4, 5, 6])
ax.set_xlim(None, 10)
ax.set_ylim(-10, None)
plt.show()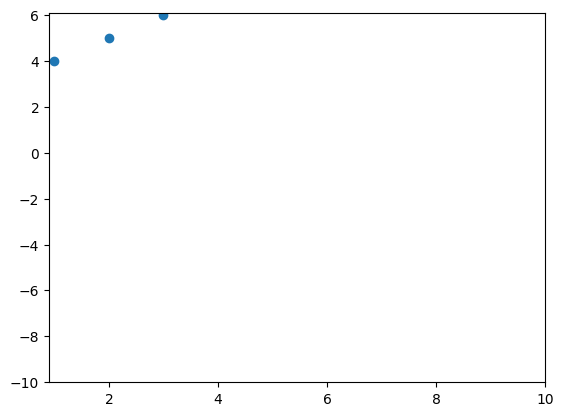
また、下限値を上限値より大きくした場合、軸が反転します。以下はx軸を反転させた例です。
fig, ax = plt.subplots()
ax.scatter([1, 2, 3], [4, 5, 6])
ax.set_xlim(10, -10)
ax.set_ylim(-10, 10)
plt.show()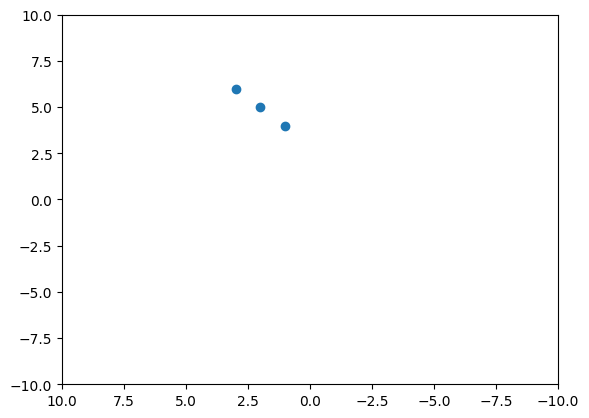
複数の軸
2つのy軸があるグラフを作成する場合、ax.twinx()メソッドを用います。反対に、2つのx軸があるグラフを作成する場合、ax.twiny()メソッドを用います。それぞれのメソッドの戻り値はAxesオブジェクトとなります。それぞれ例を以下に示します。
fig, ax = plt.subplots()
ax.plot([1, 2, 3], [4, 5, 4], label="Left axis")
ax2 = ax.twinx()
ax2.scatter([1, 2, 3], [16, 14, 15], label="Right axis", c="red")
fig.legend()
plt.show()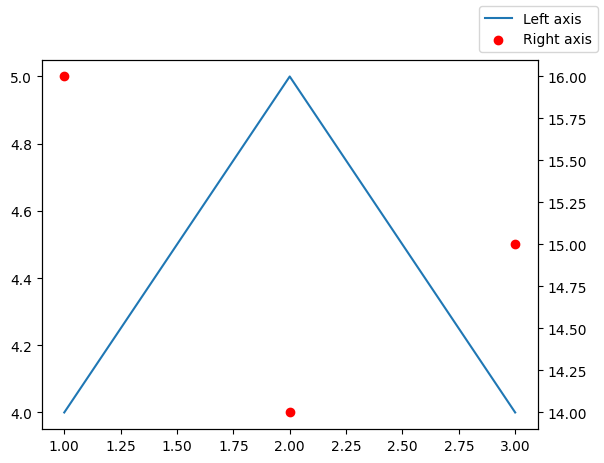
fig, ax = plt.subplots()
ax.plot([1, 2, 3], [1, 3, 2] , label="Lower axis")
ax2 = ax.twiny()
ax2.scatter([11, 12, 13], [3, 2, 1.5], label="Upper axis", c="red")
fig.legend()
plt.show()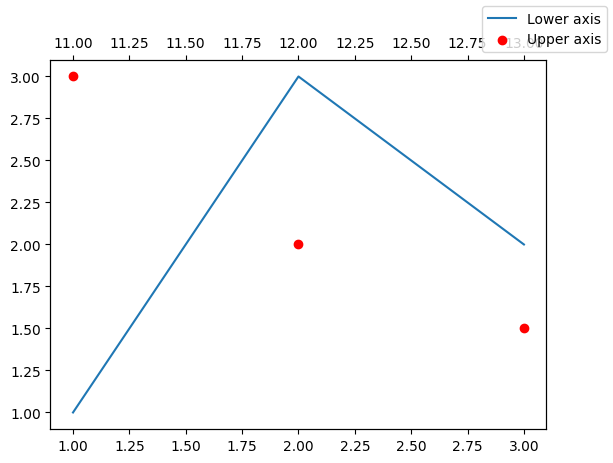
対数グラフ
軸を対数にするには、x軸ではax.set_xscale()メソッド、y軸ではax.set_yscale()メソッドを使用します。これらのメソッドのオプションに"log"を指定します。以下はx軸を対数にした例です。
fig, ax = plt.subplots()
ax.scatter([1, 10, 100], [4, 5, 6])
ax.set_xscale("log")
plt.show()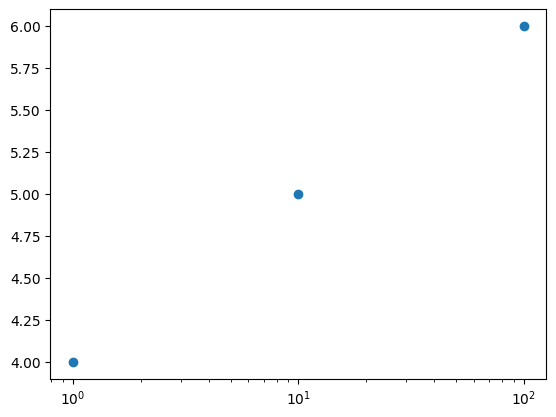
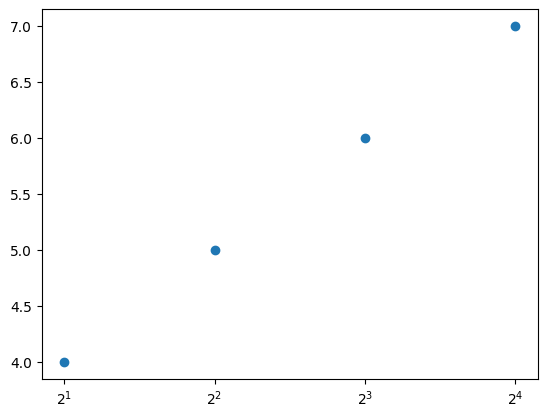
また、baseオプションで対数の「底」を指定できます。以下は底を2とした例です。x軸は2の累乗(2^1, 2^2, 2^3, 2^4)=(2, 4, 8, 16)となっています。
fig, ax = plt.subplots()
ax.scatter([2, 4, 8, 16], [4, 5, 6, 7])
ax.set_xscale("log", base=2)
plt.show()