Matplotlib 罫線の設定
公開日 2025-01-26
Matplotlibの罫線 (grid) の設定について解説します。
罫線の基本
グラフに罫線を引くにはax.grid()メソッドを用います。
以下に簡単な例を示します。
import matplotlib.pyplot as plt

fig, ax = plt.subplots()
ax.plot([1, 3, 2])
ax.grid()
plt.show()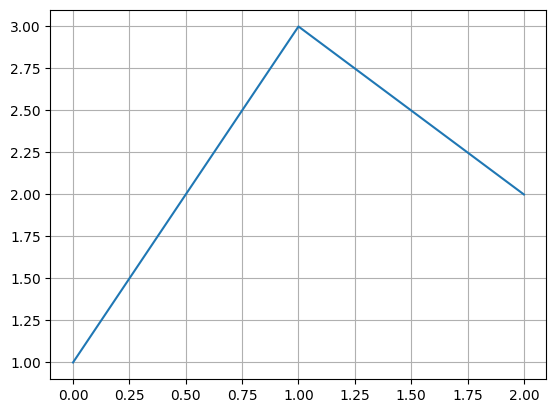
gridのオプション
ax.gridメソッドの主なオプションは以下の通りです。
| オプション | 型 | 説明 |
|---|---|---|
| axis | str | 軸を選択(‘both’, ‘x’, ‘y’) |
| which | str | 罫線を引く目盛りを指定。‘major’(主目盛り)、‘minor’(補助目盛り)、‘both’(両方の目盛り) |
| linewidth | float | 罫線の太さ |
| color | str | 罫線の色 |
| linestyle | str | 罫線の種類 |
| visible | bool | Falseの場合、罫線を非表示 |
片方の軸のみ罫線を引く
片方の軸のみ罫線を引く場合、Axes.gridメソッドのaxisオプションを使用します。
罫線を引く軸を"x"または"y"とします。
x軸のみ罫線を引く例を以下に示します。
fig, ax = plt.subplots()
ax.plot([1, 3, 2])
ax.grid(axis="x")
plt.show()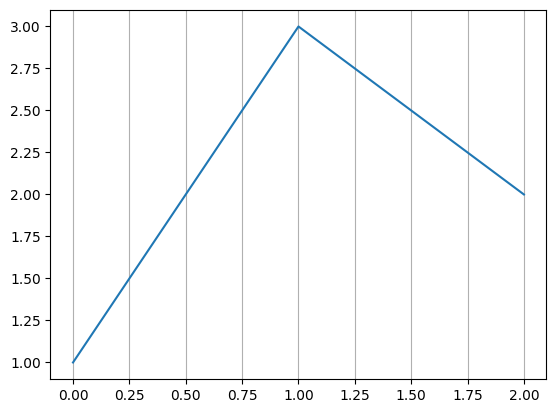
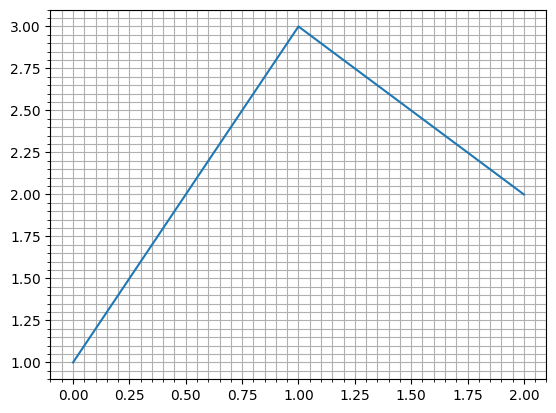
補助目盛りの罫線
grid()メソッドのwhichオプションを指定しない場合、主目盛り線に対して罫線が引かれます。
補助目盛りにも罫線を引くには、ax.minorticks_on()で補助目盛りをONにした後、ax.grid(which="both")を実行します。
fig, ax = plt.subplots()
ax.plot([1, 3, 2])
ax.minorticks_on() # 補助目盛りを表示する
ax.grid() # デフォルトでは主目盛り線のみ罫線が引かれる
plt.show()

# 主目盛りと補助目盛りの両方に罫線を引く
fig, ax = plt.subplots()
ax.plot([1, 3, 2])
ax.minorticks_on()
ax.grid(which="both")
plt.show()
罫線の太さ・色・種類
罫線の太さはlinewidthオプション、色はcolorオプション、種類はlinestyleオプションでそれぞれ変更できます。例を以下に示します。
fig, ax = plt.subplots()
ax.plot([1, 3, 2])
ax.grid(linewidth=1.5, color="green", linestyle="--")
plt.show()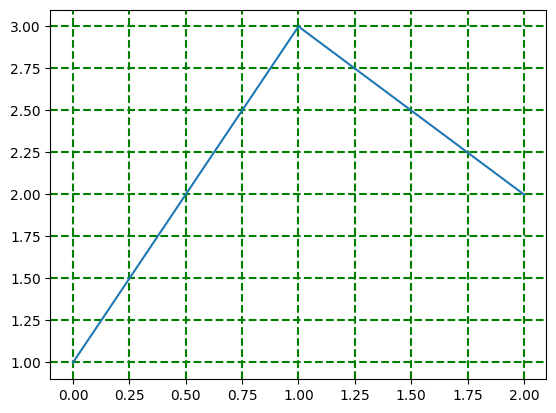
罫線を消す
罫線を強制的に非表示にする場合、grid()メソッドのvisibleオプションをFalseにします。
例を以下に示します。
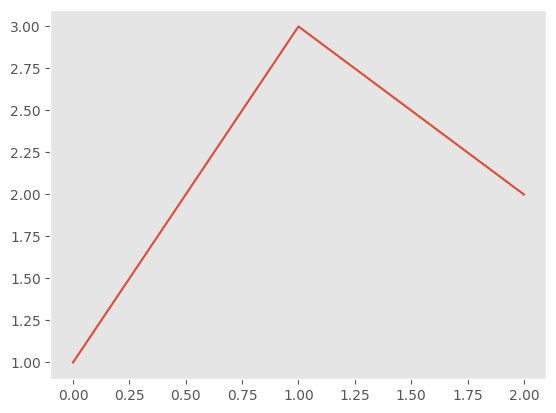
plt.style.use()では、Matplotlibのグラフのスタイルを変更できます。
"ggplot"というスタイルでは、以下のように罫線が白線で表示されます。
plt.style.use("ggplot")

fig, ax = plt.subplots()
ax.plot([1, 3, 2])
plt.show()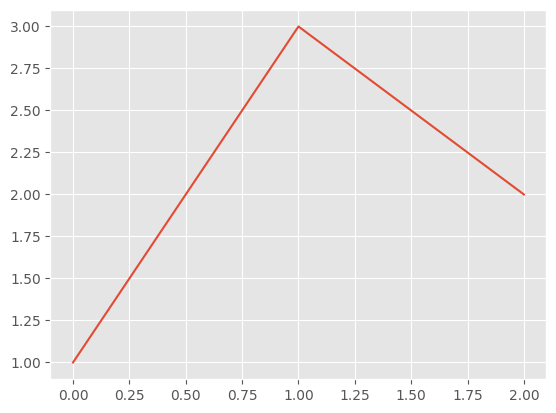
これに対して、ax.grid(visible=False)とすると罫線を非表示にできます。
plt.style.use("ggplot")

fig, ax = plt.subplots()
ax.plot([1, 3, 2])
ax.grid(visible=False)
plt.show()