Matplotlib 文字の書式
公開日 2023-08-10
この記事では、Matplotlibの文字の書式を設定する方法を解説します。
フォントに関する主な書式を以下の表に示します。
| 引数 | 説明 |
|---|---|
| fontfamily/family | ‘serif’, ‘sans-serif’, ‘cursive’(筆記体), ‘fantasy’(装飾の多いフォント), ‘monospace’(等幅フォント) |
| fontsize/size | floatの数値、または’xx-small’, ‘x-small’, ‘small’, ‘medium’, ‘large’, ‘x-large’, ‘xx-large’ |
| fontstyle/style | ‘normal’, ‘italic’(斜体), ‘oblique’(斜体) |
| fontstretch/stretch | 文字の横幅。0~1000の範囲の数値、または ‘ultra-condensed’, ‘extra-condensed’, ‘condensed’, ‘semi-condensed’, ‘normal’, ‘semi-expanded’, ‘expanded’, ‘extra-expanded’, ‘ultra-expanded’ |
| fontweight/weight | 文字の太さ。0~1000の範囲の数値、または’ultralight’, ‘light’, ‘normal’, ‘regular’, ‘book’, ‘medium’, ‘roman’, ‘semibold’, ‘demibold’, ‘demi’, ‘bold’, ‘heavy’, ‘extra bold’, ‘black’ |
| color/c | 文字の色 |
また、文字の配置に関する主な書式を以下の表に示します。
| 引数 | 説明 |
|---|---|
| horizontalalignment/ha | 横方向の位置。‘left’, ‘center’, ‘right’ |
| verticalalignment/va | 縦方向の位置。‘bottom’, ‘baseline’, ‘center’, ‘center_baseline’, ‘top’ |
| multialignment or ma | 複数行の位置。‘left’, ‘right’, ‘center’ |
| linespacing | 行間の広さをフォントサイズの倍数で指定 |
| rotation | 文字の回転。角度(°)または、‘vertical’(90), ‘horizontal’(0) |
フォントファミリー
フォントファミリー(フォントの種類)はfontfamilyまたはfamilyオプションで変更できます。‘serif’, ‘sans-serif’, ‘cursive’(筆記体), ‘fantasy’(装飾の多いフォント), ‘monospace’(等幅フォント)から選択可能です。以下に例を示します。
import matplotlib.pyplot as plt

fig, ax = plt.subplots()
ax.text(0.1, 0.9, "serif", fontfamily="serif", fontsize=20)
ax.text(0.1, 0.7, "sans-serif", fontfamily="sans-serif", fontsize=20)
ax.text(0.1, 0.5, "cursive", fontfamily="cursive", fontsize=20)
ax.text(0.1, 0.3, "fantasy", fontfamily="fantasy", fontsize=20)
ax.text(0.1, 0.1, "monospace", fontfamily="monospace", fontsize=20)
plt.show()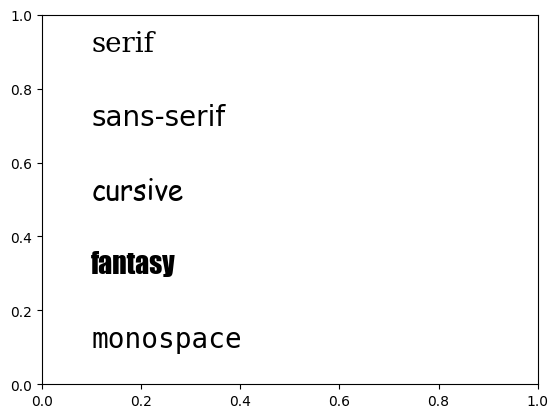
なお、ax.text(x, y, s)は文字列を描画するメソッドです。xとyは文字列の左下のx, y座標であり、sは表示する文字列です。
文字列の横幅
文字列の横幅はfontstretchまたはstretchオプションで変更できます。0~1000の範囲の数値で指定、または’ultra-condensed’, ‘extra-condensed’, ‘condensed’, ‘semi-condensed’, ‘normal’, ‘semi-expanded’, ‘expanded’, ‘extra-expanded’, 'ultra-expanded’から選択します。以下に例を示します。
fig, ax = plt.subplots()
ax.text(0.1, 0.9, "expansion (ultra-condensed)", fontstretch="ultra-condensed", fontsize=20)
ax.text(0.1, 0.7, "expansion (condensed)", fontstretch="condensed", fontsize=20)
ax.text(0.1, 0.5, "expansion (normal)", fontstretch="normal", fontsize=20)
ax.text(0.1, 0.3, "expansion (expanded)", fontstretch="expanded", fontsize=20)
ax.text(0.1, 0.1, "expansion (ultra-expanded)", fontstretch="ultra-expanded", fontsize=20)
plt.show()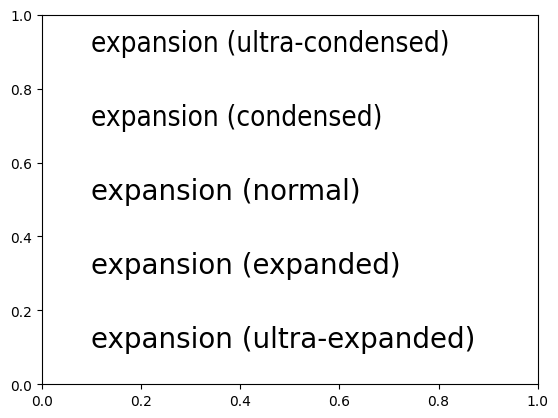
文字の太さ
文字列の太さはfontweightまたはweightオプションで変更できます。0~1000の範囲の数値で指定、または’ultralight’, ‘light’, ‘normal’, ‘regular’, ‘book’, ‘medium’, ‘roman’, ‘semibold’, ‘demibold’, ‘demi’, ‘bold’, ‘heavy’, ‘extra bold’, 'black’から選択します。以下に例を示します。
fig, ax = plt.subplots()
ax.text(0.1, 0.9, "fontweight (ultralight)", fontweight="ultralight", fontsize=20)
ax.text(0.1, 0.7, "fontweight (normal)", fontweight="normal", fontsize=20)
ax.text(0.1, 0.5, "fontweight (semibold)", fontweight="semibold", fontsize=20)
ax.text(0.1, 0.3, "fontweight (bold)", fontweight="bold", fontsize=20)
ax.text(0.1, 0.1, "fontweight (black)", fontweight="black", fontsize=20)
plt.show()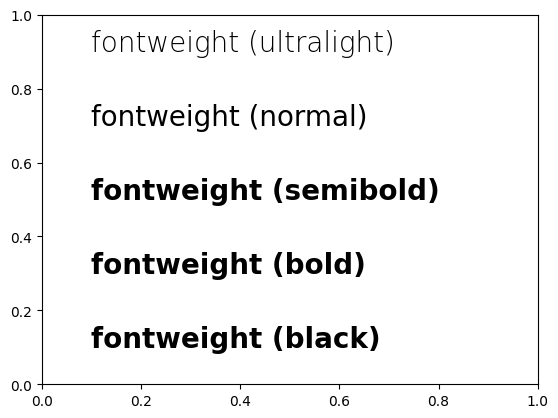
横方向の位置
テキストの横方向の位置は、horizontalalignmentまたはhaオプションに'left', 'center', 'right'のいずれかを与えて指定します。
ax.text(x, y, s)の最初の引数xで文字列の横方向の位置を指定しますが、
'left':xが文字列の左端の座標になる(デフォルト)'center':xが文字列の中央の座標になる'right':xが文字列の右端の座標になる
となります。
以下にx=0.5としたときの例を示します。
fig, ax = plt.subplots()
ax.text(0.5, 0.9, "left", horizontalalignment="left", fontsize=20)
ax.text(0.5, 0.7, "center", horizontalalignment="center", fontsize=20)
ax.text(0.5, 0.5, "right", horizontalalignment="right", fontsize=20)
ax.grid()
plt.show()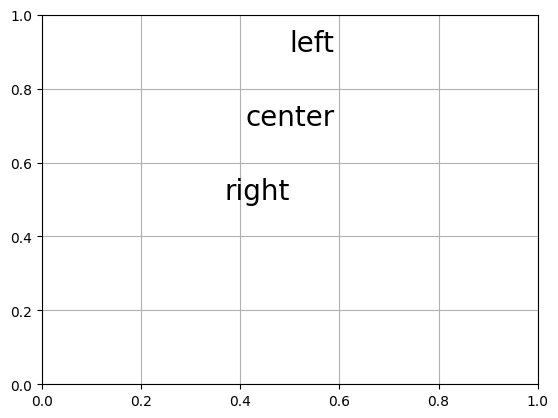
縦方向の配置
テキストの縦方向の位置は、verticalalignmentまたはvaオプションに'top', 'center', 'baseline', 'bottom'のいずれかを与えて指定します。
ax.text(x, y, s)の2番目の引数yで文字列の横方向の位置を指定しますが、
'top':yが文字列の上端の座標になる'center':yが文字列の中央の座標になる'baseline':yが文字列の下端の座標になる(デフォルト)'bottom':yがテキストボックスの下端の座標になる
となります。
以下にy=0.6としたときの例を示します。
fig, ax = plt.subplots()
ax.text(0.05, 0.6, "top", verticalalignment="top", fontsize=20)
ax.text(0.2, 0.6, "center", verticalalignment="center", fontsize=20)
ax.text(0.45, 0.6, "baseline", verticalalignment="baseline", fontsize=20)
ax.text(0.75, 0.6, "bottom", verticalalignment="bottom", fontsize=20)
ax.grid()
plt.show()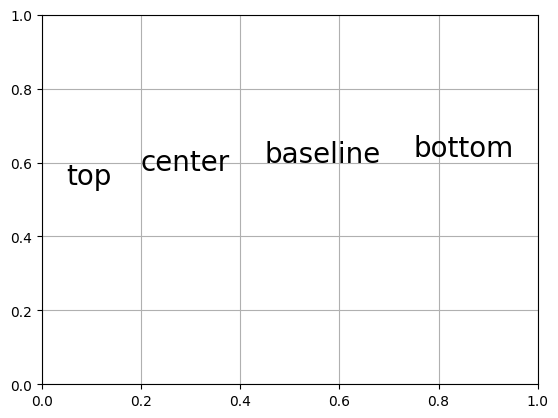
行間の広さ
テキストの行間の広さはlinespacingオプションで指定します。以下にデフォルトの行間とlinespacingを1, 1.5とした例をそれぞれ示します(デフォルトの値は1.2です)。
また、"\n"は改行を意味します。
fig, ax = plt.subplots()
ax.text(0.1, 0.2, "foo\nbar\nnspace", fontsize=20) # デフォルトの行間
ax.text(0.4, 0.2, "foo\nbar\nspace 1", linespacing=1, fontsize=20)
ax.text(0.7, 0.2, "foo\nbar\nspace 1.5", linespacing=1.5, fontsize=20)
ax.grid()
plt.show()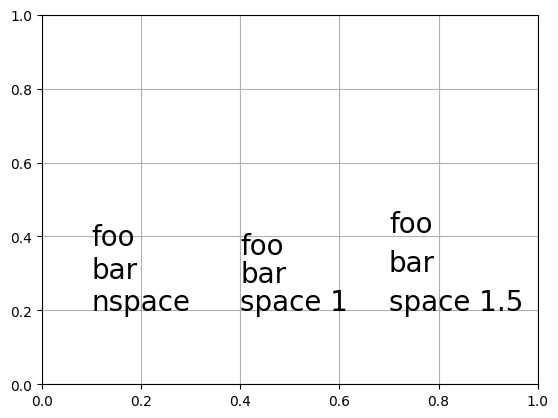
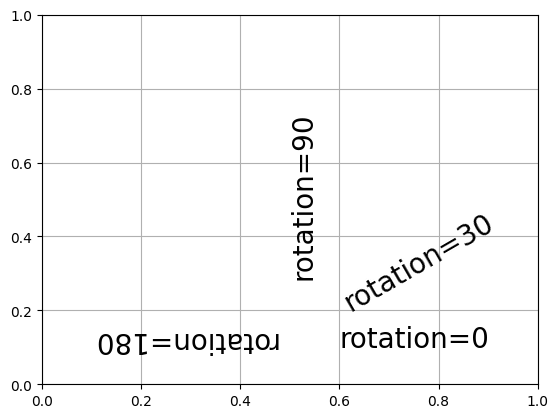
文字の回転
文字の回転角度はrotationオプションで指定します(単位は度です)。以下に角度を0(デフォルト), 30, 90, 180度にした例を示します。
fig, ax = plt.subplots()
ax.text(0.6, 0.1, "rotation=0", rotation=0, fontsize=20)
ax.text(0.6, 0.2, "rotation=30", rotation=30, fontsize=20)
ax.text(0.5, 0.3, "rotation=90", rotation=90, fontsize=20)
ax.text(0.1, 0.1, "rotation=180", rotation=180, fontsize=20)
ax.grid()
plt.show()