Matplotlibの凡例の設定
公開日 2023-08-10
この記事では、Matplotlibのグラフに凡例を表示する方法を解説します。
凡例の表示
凡例を表示する方法はいくつかあります。
1つ目は、データをプロットする際にlabel引数でラベルを設定し、legend()メソッドで凡例を表示する方法です。
2つ目は、legend()メソッドにラベルを与える方法です。ラベルはリストで与えます。
それぞれの例を以下に示します。どちらも同じ結果となります。
import matplotlib.pyplot as plt

# label引数でラベルを設定する
fig, ax = plt.subplots()
ax.plot([1, 3, 2], label="data 1")
ax.plot([3, 1, 1], label="data 2")
ax.legend()
plt.show()

# legend()メソッドにラベルを与える
fig, ax = plt.subplots()
ax.plot([1, 3, 2])
ax.plot([3, 1, 1])
ax.legend(["data 1", "data 2"])
plt.show()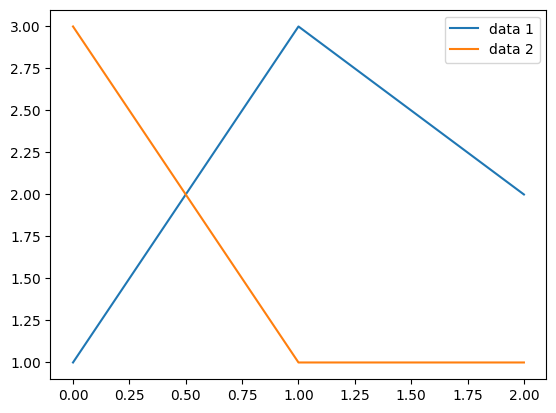
凡例の位置
凡例の位置はlegend()メソッドのlocオプションで指定できます。デフォルト値はbest(プロットと凡例がなるべく重ならないように配置する)です。また、以下からも指定可能です。
---------------------------------------
|upper left |upper center|upper right |
---------------------------------------
|center left|center      |center right|
---------------------------------------
|lower left |lower center|lower right |
---------------------------------------
凡例の位置を左側中段 (center left) とした例を以下に示します。
fig, ax = plt.subplots()
ax.plot([1, 3, 2], label="data 1")
ax.plot([3, 1, 1], label="data 2")
ax.legend(loc="center left")
plt.show()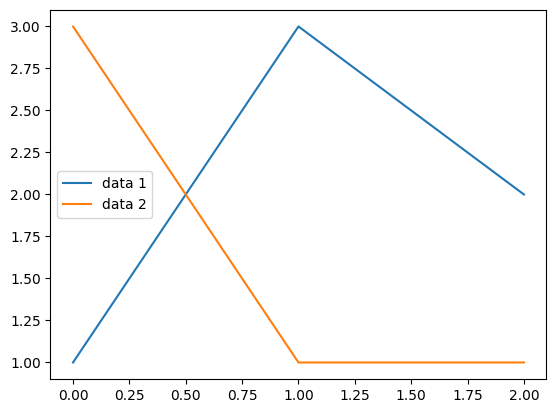
また、凡例の位置はbbox_to_anchorオプションでも指定可能です。このオプションに座標を(x, y)で渡します。グラフの左下が(0, 0), 右上が(1, 1)となります。bbox_to_anchorにそれぞれ(0, 0)と(1, 1)を指定した例を以下に示します。
fig, ax = plt.subplots()
ax.plot([1, 3, 2], label="data 1")
ax.plot([3, 1, 1], label="data 2")
ax.legend(bbox_to_anchor=(0, 0))
plt.show()

fig, ax = plt.subplots()
ax.plot([1, 3, 2], label="data 1")
ax.plot([3, 1, 1], label="data 2")
ax.legend(bbox_to_anchor=(1, 1))
plt.show()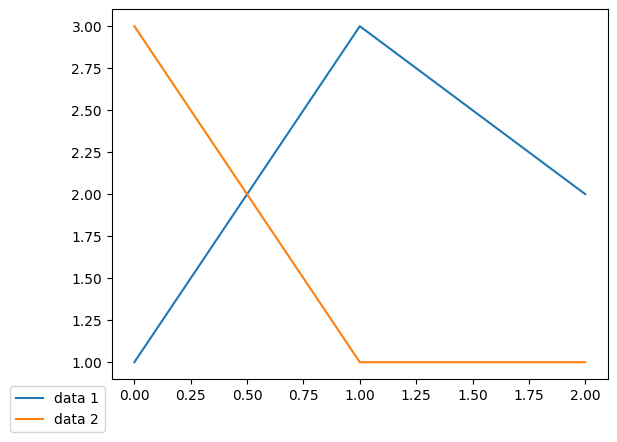
凡例の列数
凡例の列数はlegend()メソッドのncolオプションで指定できます。以下は列数を2とした例です。
fig, ax = plt.subplots()
ax.plot([1, 3, 2], label="data 1")
ax.plot([3, 1, 1], label="data 2")
ax.plot([2, 2, 1], label="data 3")
ax.legend(ncol=2)
plt.show()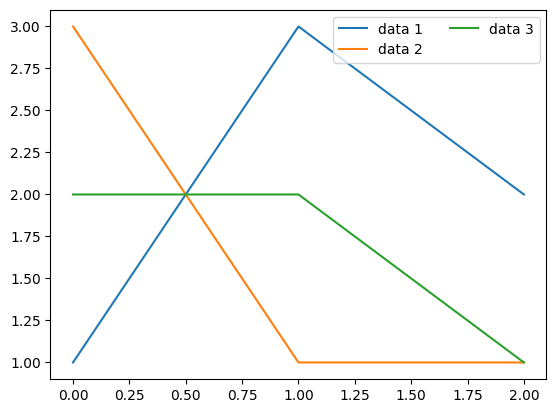
凡例の色
凡例の文字色はlegend()メソッドのlabelcolor, 背景色はfacecolor, 枠線の色はedgecolorでそれぞれ指定できます。また、背景色の透過度はframealphaで指定できます(0~1の範囲で指定し、値が小さいほど透明に近づきます)。
fig, ax = plt.subplots()
ax.plot([1, 3, 2], label="data 1")
ax.plot([3, 1, 1], label="data 2")
ax.legend(labelcolor="red", facecolor="blue", edgecolor="orange", framealpha=0.2)
plt.show()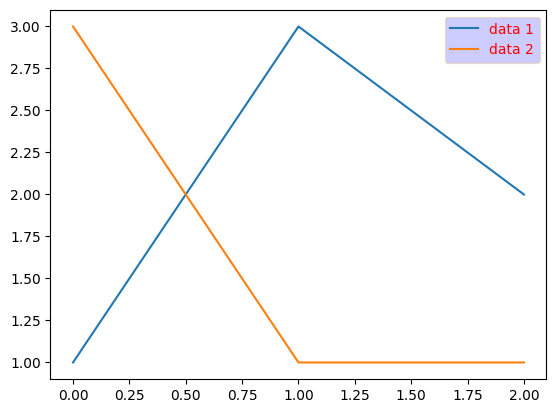
凡例の文字サイズ
凡例の文字サイズはlegend()メソッドのfontsizeオプションで指定できます。整数または次のいずれかから指定可能です。
{"xx-small", "x-small", "small". "medium", "large", "x-large", "xx-large"}
fig, ax = plt.subplots()
ax.plot([1, 2, 2], label="data 1")
ax.plot([3, 1, 1], label="data 2")
ax.legend(fontsize=18)
plt.show()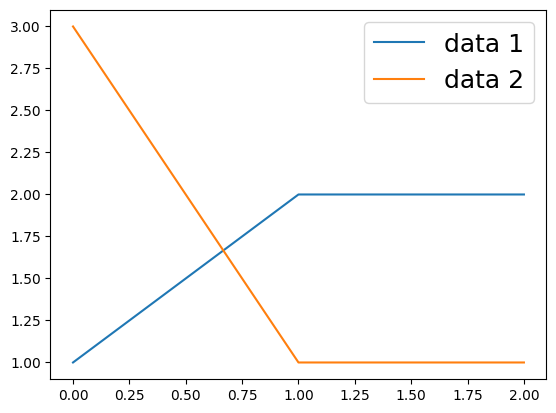
凡例のタイトル
凡例にタイトルを設定する場合、legend()メソッドのtitleオプションで指定できます。以下はタイトルを"Prices"と設定した例です。
fig, ax = plt.subplots()
ax.plot([1, 2, 2], label="data 1")
ax.plot([3, 1, 1], label="data 2")
ax.legend(title="Prices")
plt.show()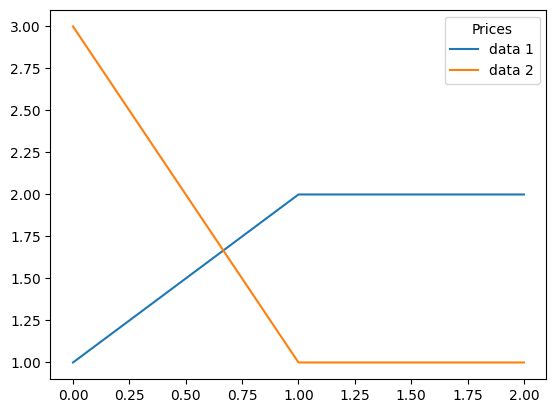
Figureに凡例を表示する
上記の例では、Axesに凡例を表示していましたが、Figureに表示することも可能です。以下のようにFigureオブジェクトのlegend()メソッドを用います。
fig, ax = plt.subplots()
ax.plot([1, 2, 2], label="data 1")
ax.plot([3, 1, 1], label="data 2")
fig.legend()
plt.show()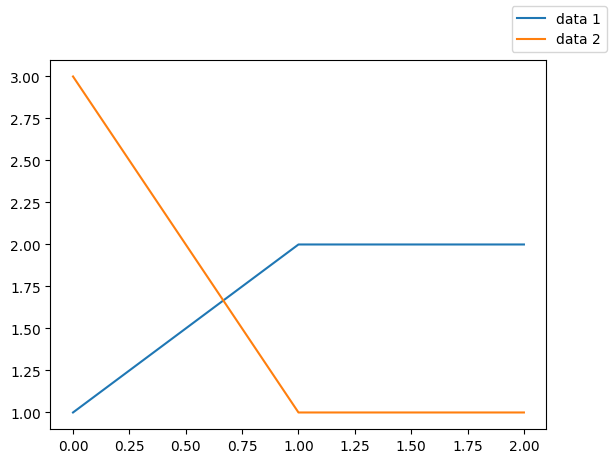
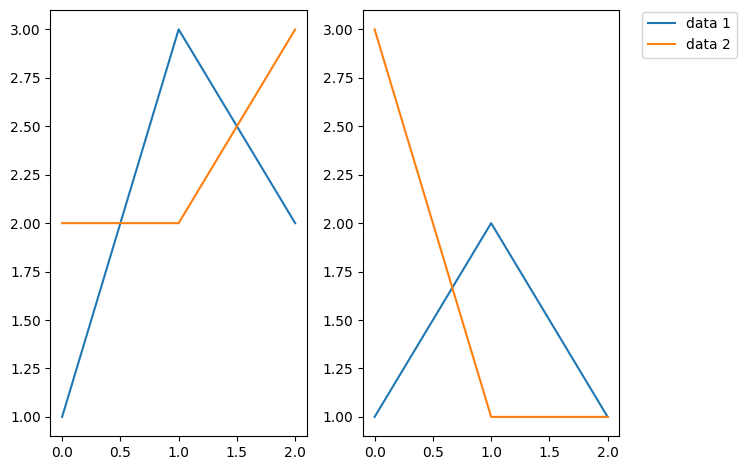
Figureオブジェクトに凡例を表示したケースとして、以下のように1つのFigureオブジェクトに複数のグラフがある場合が挙げられます。凡例を1つだけ表示することで、グラフの見た目をすっきりとさせられます。
fig, ax = plt.subplots(ncols=2)
ax[0].plot([1, 3, 2])
ax[0].plot([2, 2, 3])
ax[1].plot([1, 2, 1])
ax[1].plot([3, 1, 1])
fig.legend(["data 1", "data 2"], bbox_to_anchor=(1.17, 0.98))
fig.tight_layout()
plt.show()