Matplotlibの目盛りの設定
公開日 2023-08-10
最終更新日 2025-01-26
Matplotlibの目盛りの設定(補助目盛りや目盛り線など)について解説します。
補助目盛り
補助目盛りを表示するには、Axes.minorticks_on()メソッドを用います。
import matplotlib.pyplot as plt
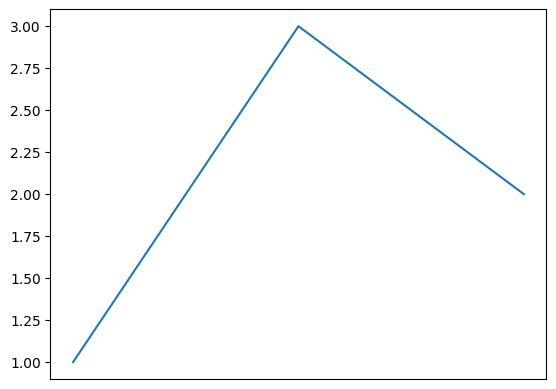
# 補助目盛りなし
fig, ax = plt.subplots()
ax.plot([1, 3, 2])
plt.show()
# 補助目盛りあり
fig, ax = plt.subplots()
ax.plot([1, 3, 2])
ax.minorticks_on()
plt.show()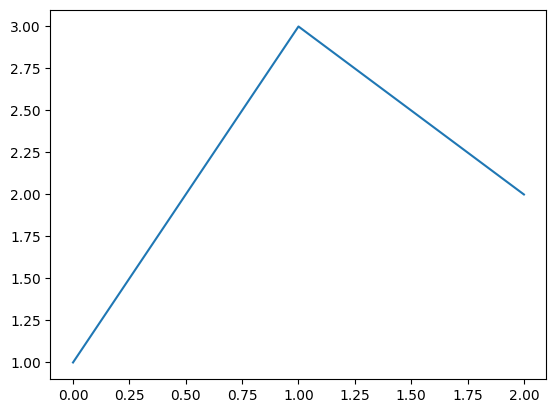

tick_params
目盛りの詳細な設定をするには、Axes.tick_params()メソッドを用います。このメソッドの主なオプションを以下に示します。
| オプション | 型 | 説明 |
|---|---|---|
| axis | str | 軸を選択(‘both’, ‘x’, ‘y’) |
| which | str | 目盛り線の種類を指定。‘major’(主目盛り)、‘minor’(補助目盛り)、‘both’(両方の目盛り) |
| direction | str | 目盛りの位置。‘in’, ‘out’, ‘inout’ |
| length | float | 目盛りの長さ |
| width | float | 目盛りの幅 |
| color | str | 目盛りの色 |
| pad | float | 目盛りと目盛りラベルの隙間 |
| labelsize | float | 目盛りラベルの大きさ |
| labelcolor | str | 目盛りラベルの色 |
| colors | str | 目盛りと目盛りラベルの色 |
| zorder | float | 描画する順序 |
| labelrotation | float | 目盛りラベルの回転角度(反時計回りに回転。単位は度) |
なお、Axes.tick_params()メソッドで補助目盛りの設定をする場合、Axes.minorticks_on()メソッドを実行する必要があります。
目盛りの向き
目盛りの向きはdirectionオプションで指定できます。inで内側、outで外側(デフォルト)、inoutで両方となります。
# 内側
fig, ax = plt.subplots()
ax.plot([1, 3, 2])
ax.tick_params(direction='in')
plt.show()

# 両方
fig, ax = plt.subplots()
ax.plot([1, 3, 2])
ax.tick_params(direction='inout')
plt.show()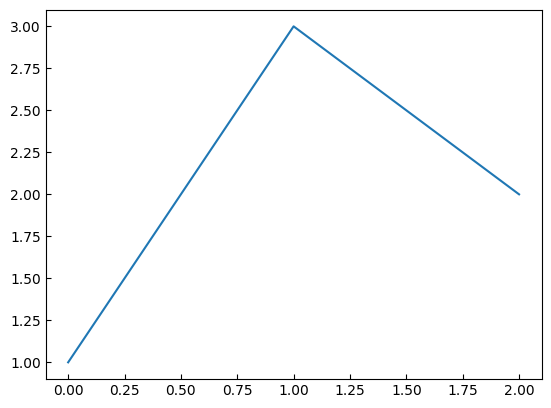

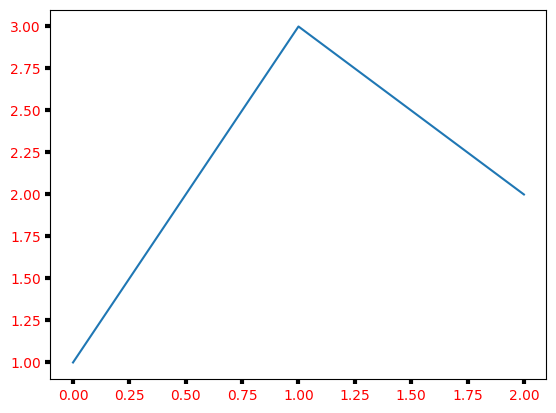
目盛りとラベルの色
colorオプションでは目盛り線のみ、colorsオプションでは目盛り線と目盛りラベルの両方の色を変更できます。また、labelcolorオプションでは、目盛りラベルのみ色を変更できます。
# 目盛り線を赤色に設定
fig, ax = plt.subplots()
ax.plot([1, 3, 2])
ax.tick_params(color="red", width=3)
plt.show()

# 目盛り線と目盛りラベルを赤色に設定
fig, ax = plt.subplots()
ax.plot([1, 3, 2])
ax.tick_params(colors="red", width=3)
plt.show()

# 目盛りラベルを赤色に設定
fig, ax = plt.subplots()
ax.plot([1, 3, 2])
ax.tick_params(labelcolor="red", width=3)
plt.show()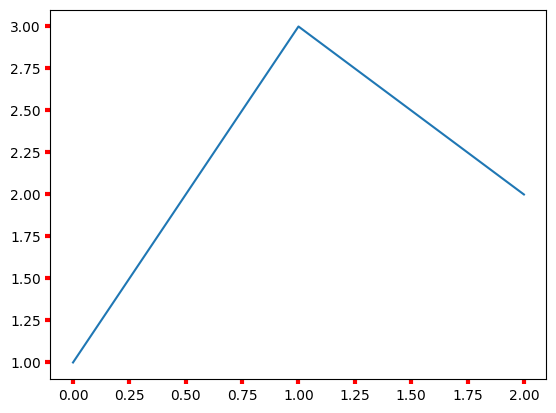

目盛りラベルの回転
labelrotationオプションによって目盛りラベルを回転できます。反時計回りに回転し、単位は度です。
fig, ax = plt.subplots()
ax.plot([1, 3, 2])
ax.tick_params(labelrotation=45)
plt.show()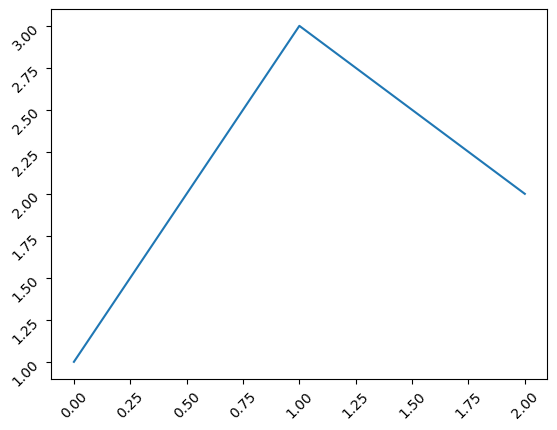
x軸またはy軸のみの目盛りラベルを回転させる場合、ax.tick_params()メソッドのaxisオプションで指定します。
fig, ax = plt.subplots()
ax.plot([1, 3, 2])
ax.tick_params(axis="x", labelrotation=45)
ax.tick_params(axis="y", labelrotation=-10)
plt.show()
目盛りラベルの非表示
x軸とy軸の目盛りラベルを非表示にする場合、ax.set_xticks([]), ax.set_yticks([])を実行します。
set_xticks()は目盛りのラベルを設定するメソッドです。
これに空のリスト[]を渡すことで、目盛りラベルを非表示にします。
fig, ax = plt.subplots()
ax.plot([1, 3, 2])
ax.set_xticks([])
plt.show()