Matplotlibに関するTips
公開日 2023-08-10
最終更新日 2024-07-28
このページではMatplotlibに関するTips(小ネタ)を解説します。
グラフサイズの変更
グラフのサイズを変更する場合、plt.subplots()関数のfigsize引数を使用します。サイズは横方向、縦方向の順にタプルで与えます。
import matplotlib.pyplot as plt

fig, ax = plt.subplots(figsize=(7, 2))
ax.plot([1, 3, 2])
plt.show()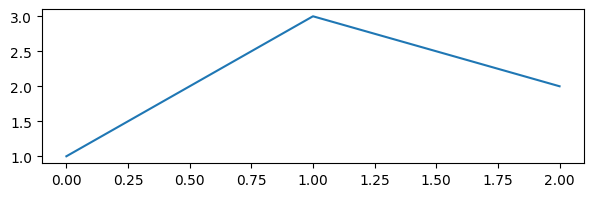
余白の自動調整
fig.tight_layout()関数を実行すると、グラフの余白を埋めたり、オブジェクト(文字列など)が重ならないように位置を調節したりしてくれます。
fig, ax = plt.subplots(figsize=(7, 2))
ax.plot([1, 3, 2])
fig.tight_layout()
plt.show()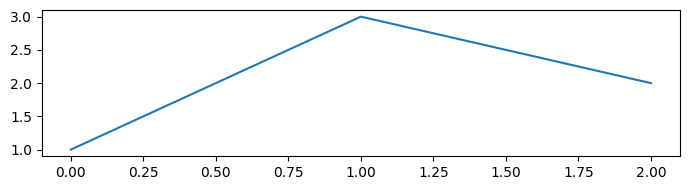
グラフウィンドウを全て閉じる
Pythonを実行する環境によっては、Matplotlibのグラフが個別のウィンドウで表示されます。これを全て閉じるにはplt.close("all")を実行します。